A Gartner Cool Vendor in Data Management
How It Works
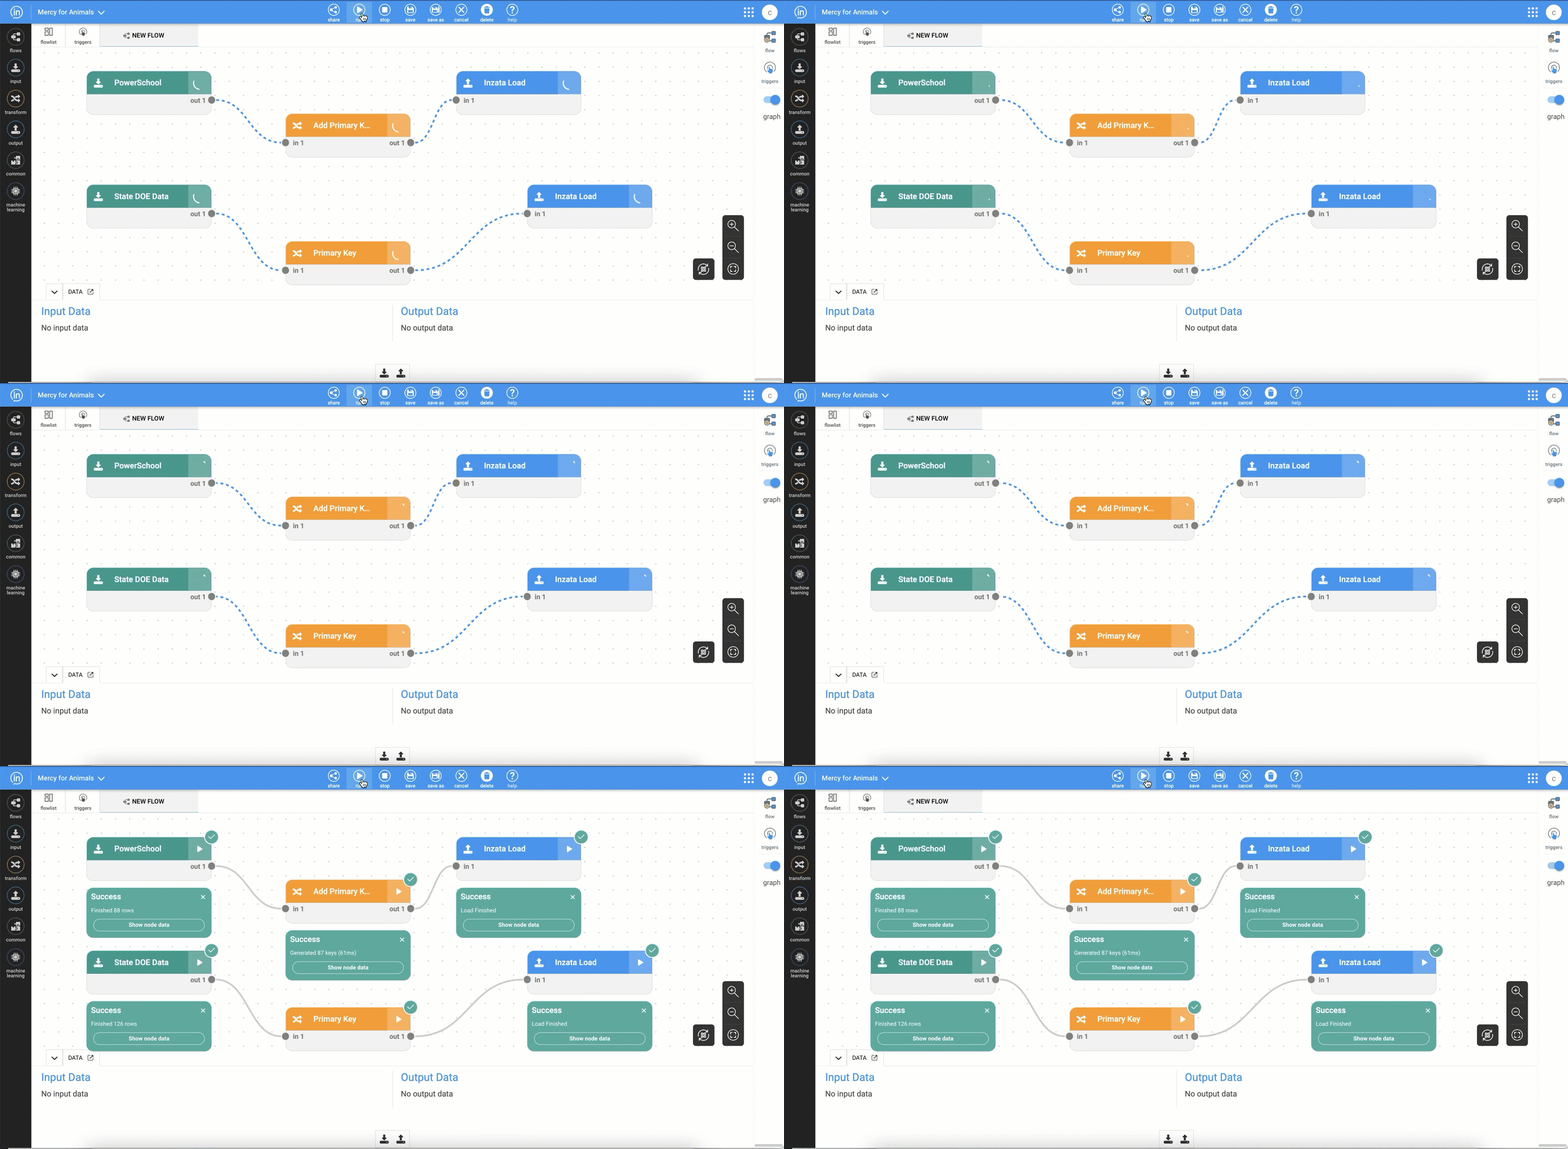
Step 1. Connect to data
- More than 400 data connectors
- Point-and-click to build Data Pipelines to your systems and data sources.
- Automate data loading
- Refresh data as often as you want!
- Use Inzata’s robust, automated Data Extraction & Ingestion tools to connect to your different data sources.
- No SQL, no ETL!
- Timer/triggers schedule & automate data refreshes from source.
Inzata validates and quality-checks data as it flows through every time, and can be used to standardize, clean and format data before it makes its way into your Data Warehouse.
Start creating real-time data pipelines and never collect data manually again!

Step 2. Work with Inzata's AI-assistant to craft your logical data Model
Once two or more data sources have been loaded, Inzata’s AI data modeler begins analyzing every column and field to determine how the different data sets fit together into a logical, insightful model.
Student data is identified, and matched with other student-level data. The same happens for teacher, and so on with attendance, discipline, assessment, grades and instructional data.
In minutes your school’s hierarchies and key relationships are clearly modeled in your data. What was different, separate data now becomes a single model, with the power to answer much deeper questions for you and your users.

Inzata’s AI accomplishes in minutes what normally takes months. It delivers the same high quality, multidimensional data models, star and snowflake schemas, with unprecedented functionality, 1,000 times faster than unassisted methods.
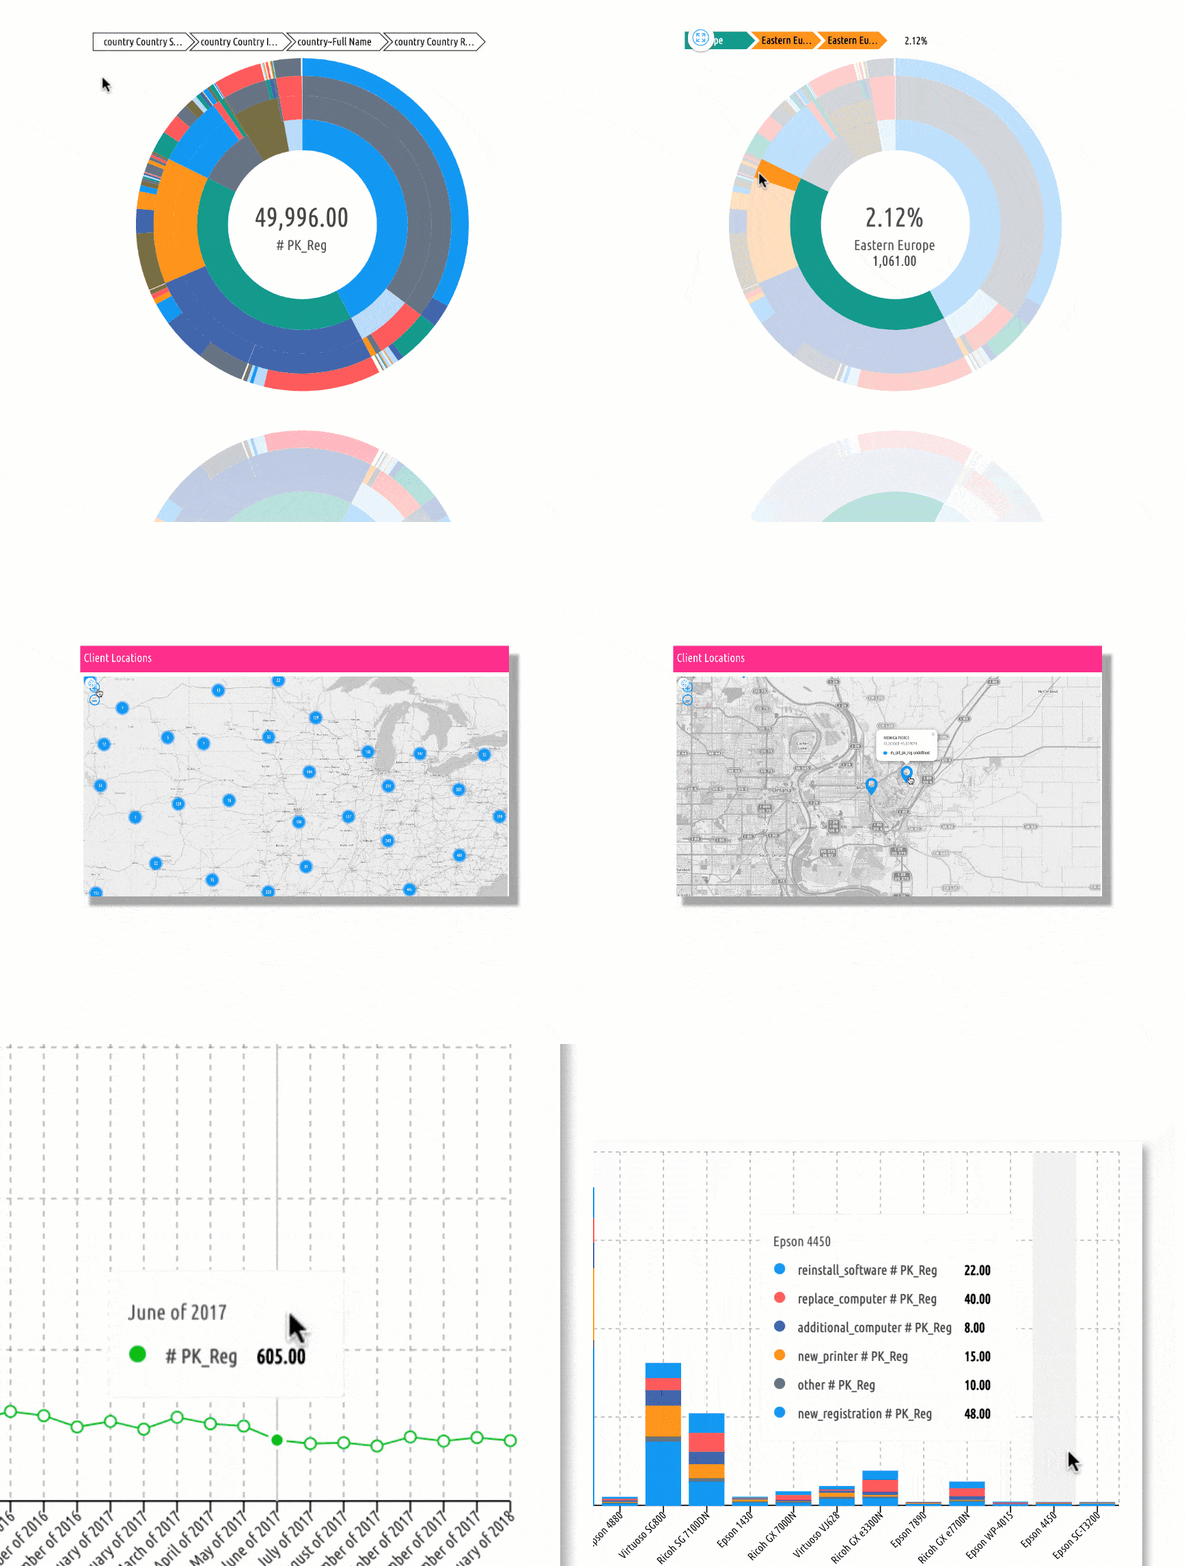
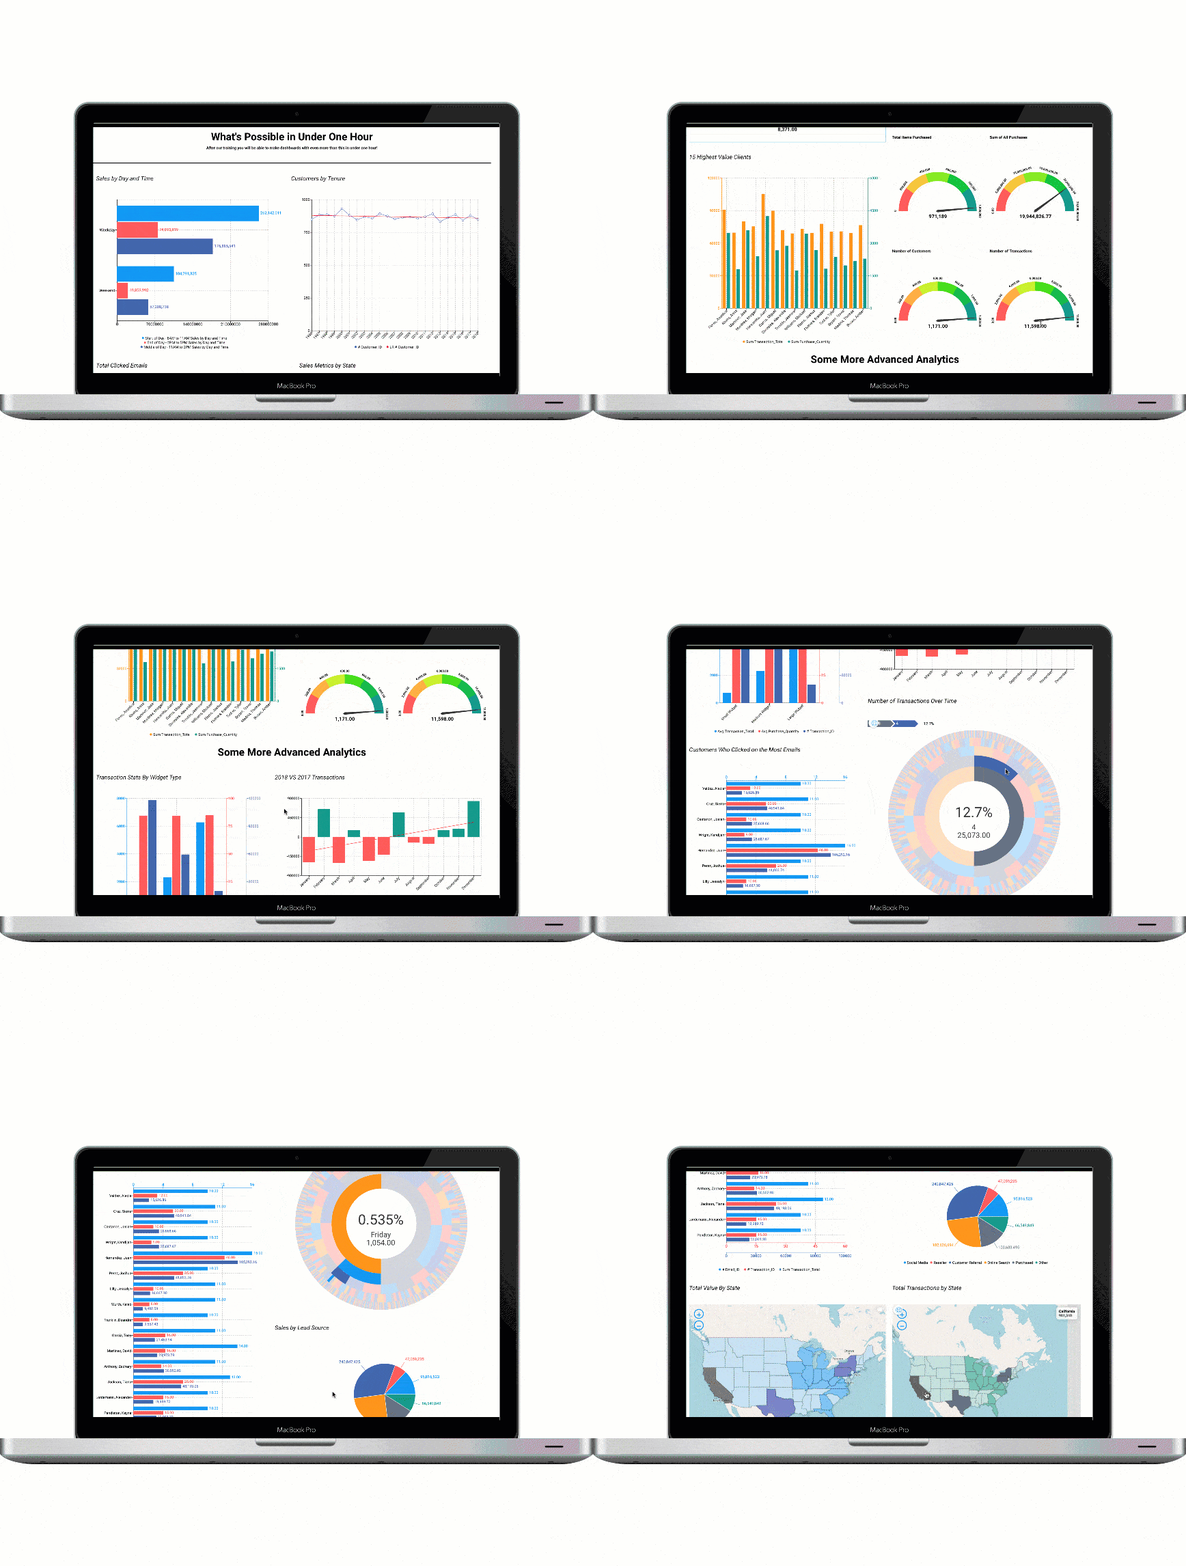
Step 3. Get insights with Beautiful Data Visualizations and Dashboards
With the model created, your data warehouse is done! All of your ETL has been created by Inzata. Metrics and aggregations are auto created as well, and you can create your own custom ones. Your data mappings are done!
You’re now ready to begin creating dashboards!


